Graphviz is the veteran graph-layout toolkit behind the DOT language. Mermaid is the newer, Markdown-friendly option. Both describe graphs as text, but they target different needs.
At a glance
| Mermaid | Graphviz | |
|---|---|---|
| Focus | Many diagram types for docs | General graph layout |
| Runs in browser | Yes, natively | Via WebAssembly ports |
| Markdown platform support | Wide | Rare |
| Layout control for huge graphs | Good for small/medium | Excellent, many engines |
| Sequence, Gantt, charts | Yes | No |
Same graph, two syntaxes
flowchart LR
    A --> B
    A --> C
    B --> D
C --> Ddigraph G {
rankdir=LR;
A -> B; A -> C;
B -> D; C -> D;
}Pick Graphviz for very large generated graphs (dependency graphs, call graphs). Pick Mermaid for human-written documentation diagrams that need to render on GitHub and in docs tools.
A fair mermaid vs graphviz comparison starts from the job of the graph, not from a benchmark nobody published. Graphviz is a layout toolkit. Its language is DOT. It has been turning text into node-and-edge pictures for decades, and it is still the tool people reach for when a program, not a person, is going to emit thousands of edges. Mermaid is a documentation language that includes flowcharts among many other diagram types. It is pleasant to write by hand, and it renders in Markdown hosts that have never heard of DOT. They overlap on "boxes and arrows." They do not compete on most other days.
We are not going to invent timings, node limits, or a claim that one engine is "ten times" anything. If you need a number, measure your graph on your machine. What follows is the qualitative split that holds up without a stopwatch: who writes the file, where it has to render, and how much graph is too much graph.
The same small graph in both languages
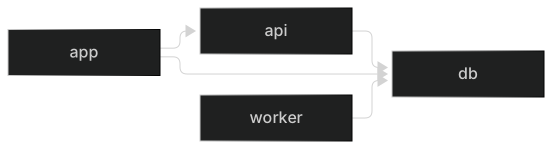
A left-to-right dependency sketch is legal in both. Mermaid first:
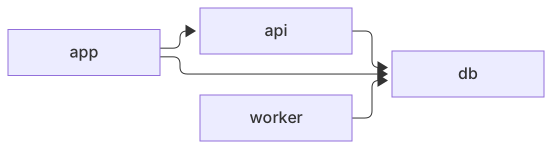
flowchart LR
  app --> api
  app --> db
  api --> db
worker --> dbThe DOT for that picture is just as short. Graphviz will lay it out with its own rules, so the pixels will not match, and they do not need to.
digraph deps {
  rankdir=LR;
  app -> api;
  app -> db;
  api -> db;
  worker -> db;
}
At this size, pick Mermaid if the picture is going into a README, and pick DOT if the picture is going into a pipeline that already speaks Graphviz. Taste can break the tie. The languages are both readable. Neither requires an account. Both are open source. The interesting differences show up when the graph grows, or when the file has to live in a Markdown host.
What Graphviz is unusually good at
Graphviz is a layout engine with a language attached. DOT describes nodes, edges, and attributes. The dot program, and the other layout engines shipped with Graphviz, decide positions. People use it for dependency graphs, call graphs, import graphs, state machines generated from a model, and any picture that would be ridiculous to arrange by hand. A script writes the DOT. Graphviz writes the SVG or PNG. Humans look at the picture and, when it is wrong, fix the generator rather than the coordinates.
That workflow is the one to protect. If your build already emits DOT from a compiler, a package manifest, or a query, do not rewrite the emitter in Mermaid for fashion. You would be trading a tool that is aimed at generated graphs for a tool aimed at hand-written docs. Keep Graphviz on that path. Check the output into the build, or render it in CI, and link the image from the doc that explains it.
Layout engines are part of why people stay. Graphviz ships more than one. dot is the usual hierarchical layout. Others, such as neato, fdp, circo, and twopi, exist for graphs that are not a tidy top-down tree. We are not ranking them. We are noting that "try another engine" is a real knob when a generated graph looks like a knot. Mermaid's flowchart directions are a smaller set of choices. For a hand-written ten-node picture, that is plenty. For a generated hairball, it is not the same toolbox.
Attributes in DOT go further than most people use: shapes, clusters, ports on a node, edge weights, rank constraints. You can overfit a picture until it matches a paper. You can also build a style guide for everything your generator emits. Mermaid can color nodes and set directions. It is not trying to be a general graph-drawing language with a twenty-year attribute list. Handing it that job makes both the author and the renderer unhappy.
Where Mermaid is the better default
Mermaid is for diagrams a person writes and a documentation page renders. A flowchart is one type. Sequence diagrams, class diagrams, state diagrams, entity-relationship diagrams, Gantt charts, and a pile of charts are others. Graphviz does not try to be that catalog. If the page needs a sequence diagram under the flowchart, DOT will not grow one. You would add a second tool. Mermaid keeps them in one fence type.
Markdown support is the everyday gap. GitHub and GitLab render a mermaid fence in the page. They do not render DOT. A .dot file in a repository is source, not a picture, until something runs Graphviz. Some static-site pipelines will do that, and that is a good pipeline if you already have it. It is a weak default for a README on github.com, where the reader expects the image to appear without a build they cannot see. "Weak Markdown support" is not an insult to Graphviz. It is a description of where DOT is welcome. The welcome mat is a build step, not the Markdown renderer.
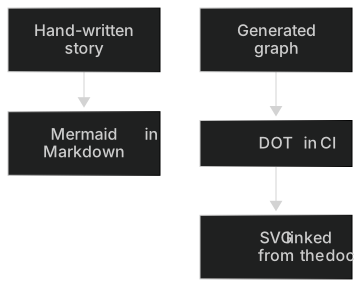
Here is the habit that works. The explanation and the small hand-drawn flows live in Mermaid, in the file the reader opens. The huge generated graph stays in DOT, rendered to SVG in CI, with a link from the doc. Readers who need the hairball download it. Readers who need the story are not forced to zoom a thousand-node picture that no layout can make polite.
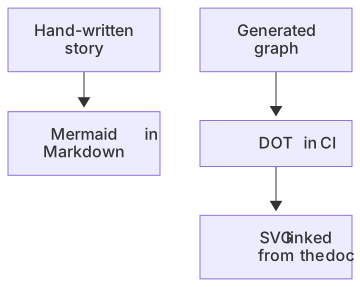
flowchart TD
  A[Hand-written story] --> B[Mermaid in Markdown]
  C[Generated graph] --> D[DOT in CI]
D --> E[SVG linked from the doc]Syntax weight and who has to edit it
DOT is easy for a generator and a bit fussy for a casual editor. Quotes, semicolons, and attributes are normal. A person can learn the subset in the example above in a few minutes. They tend to bounce off a file that sets ranksep, ports, and HTML-like labels, which generated files often do. That is acceptable when humans do not hand-edit the output. It is a problem when they do. If you want humans to patch the graph, emit simple DOT, or emit Mermaid.
Mermaid's flowchart syntax is aimed at the human case. The failure mode is the opposite. A generator that naively prints tens of thousands of Mermaid nodes will produce a file that is slow to preview in a browser and hopeless to read. We do not have a measured cutoff to hand you. "Huge" is "the preview stops being a conversation." When you hit it, stop, and let Graphviz own that file. Splitting the graph by subsystem is the other fix, and it helps both tools. A diagram a human will not read is not documentation. It is a data dump with arrows.
Labels should stay short in both. Graphviz will not make a paragraph readable just because the layout is famous. Mermaid will not either. Put the essay in the Markdown around the figure.
Rendering and files
Graphviz output is usually SVG or PNG from the command line. That file is what you commit or what CI publishes. SVG is the right default when people will zoom. PNG is the right default when the destination is a ticket system that strips SVG. You own regeneration. If the generator changes and nobody reruns Graphviz, the committed picture lies.
Mermaid output can be the live render on GitHub, so there is no second file to drift. When you do need a file, export PNG or SVG. The export guide and the PNG and SVG converters are for that moment. The converters run in the browser. They are not a Graphviz replacement, and they will not layout a DOT file. Mermaid does not parse DOT. A small graph can be rewritten by hand, as the pair at the top of this page shows. A large generated graph should stay in the generator. Asking an editor to translate ten thousand edges by eye is how you invent edges.
A choice you can defend
Use Graphviz when a program writes the graph, when the graph is large, when you need a DOT layout engine, and when publishing an SVG from CI is acceptable. Use Mermaid when a person writes the diagram, when it lives in GitHub or GitLab Markdown, and when you may also need a sequence, a state machine, or a chart on the same page. Use both when the system has a story and a hairball. The story is Mermaid. The hairball is DOT.
There is no prize for standardising on one language past the point where it fits. A team that forces generated dependency graphs into Mermaid will hate the preview. A team that forces every README flowchart through Graphviz will hate the missing native render and the extra build. The examples above are the whole migration test for a small graph. For a large one, time your own render and look at the picture. If we have not quoted a number, it is because a borrowed number would be fiction.
The language choice, rather than the product pages, is DOT language vs Mermaid.
Frequently asked questions
Can Mermaid render DOT files?
No, Mermaid has its own syntax. You can ask MermaidViewer's AI to convert simple DOT graphs into Mermaid flowcharts.