Basic timeline example
timeline
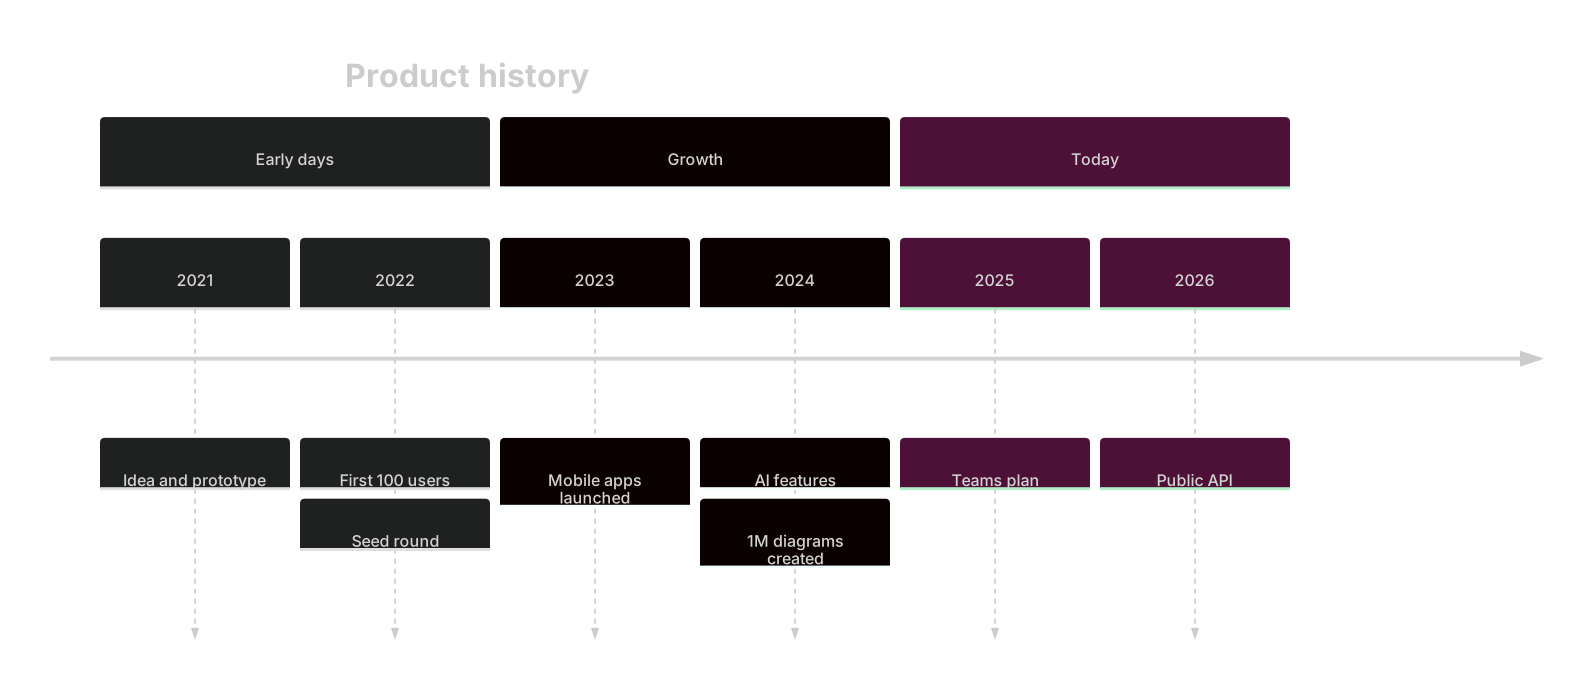
    title Product history
    section Early days
      2021 : Idea and prototype
      2022 : First 100 users : Seed round
    section Growth
      2023 : Mobile apps launched
      2024 : AI features : 1M diagrams created
    section Today
      2025 : Teams plan
2026 : Public APIMermaid timelines list events in chronological order. Each line is a time period followed by one or more events, which makes them perfect for company histories, product changelogs and roadmaps that don't need exact dates.
Unlike Gantt charts, timelines don't need durations or date formats. You write the periods as plain text — years, quarters or phases — and Mermaid lays them out evenly.
When to use a timeline
- Company and product history
- Release changelogs
- Quarterly roadmaps
- History lessons and biographies
Timeline syntax reference
| Syntax | What it does |
|---|---|
timeline | Start a timeline. |
title Text | Timeline title. |
Period : Event | A period with one event. |
Period : Event 1 : Event 2 | Several events in one period. |
section Name | Group periods into colored sections. |
Timeline examples
Quarterly roadmap
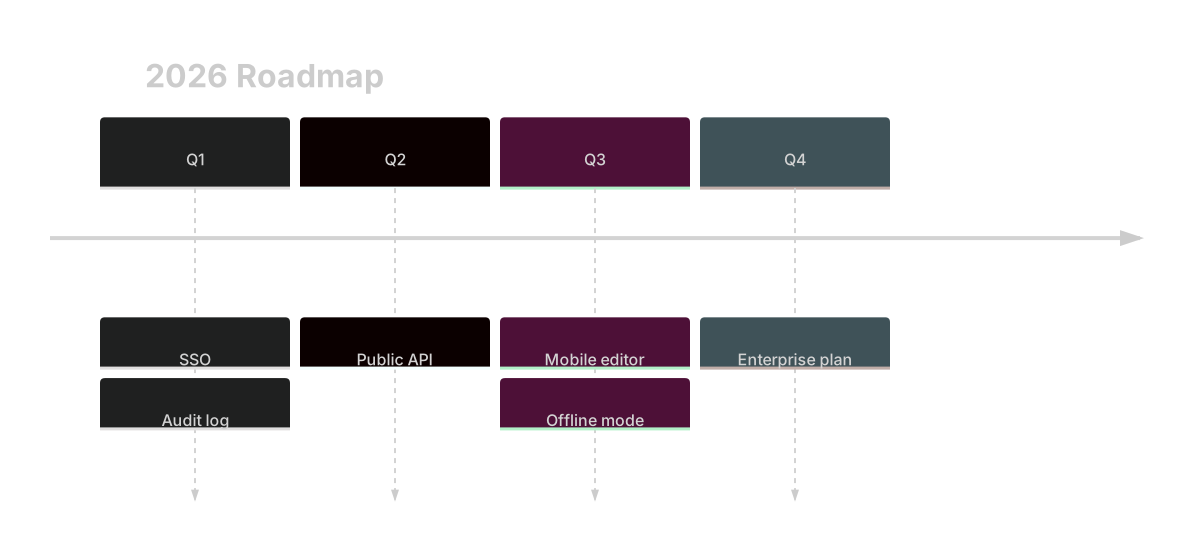
Periods can be any text, such as quarters.
timeline
    title 2026 Roadmap
    Q1 : SSO : Audit log
    Q2 : Public API
    Q3 : Mobile editor : Offline mode
Q4 : Enterprise planTips and best practices
- Use sections to color-code eras or phases.
- Put multiple events on separate lines starting with a colon to keep long periods readable.
- Use a Gantt chart instead when you need real dates and durations.
Generate a timeline with AI
Not sure where to start? Describe what you need and the AI timeline generator writes the Mermaid code for you. Try prompts like:
- “History of the internet”
- “Startup fundraising journey”
- “Evolution of JavaScript frameworks”
Timeline templates
Timeline FAQ
What is the difference between a Mermaid timeline and a Gantt chart?
A timeline shows events per period with no durations, while a Gantt chart uses real dates, durations and dependencies. Use timelines for history and high-level roadmaps, Gantt charts for schedules.
Can a period have multiple events?
Yes. Separate events with colons on one line, or continue on new lines that start with a colon under the same period.