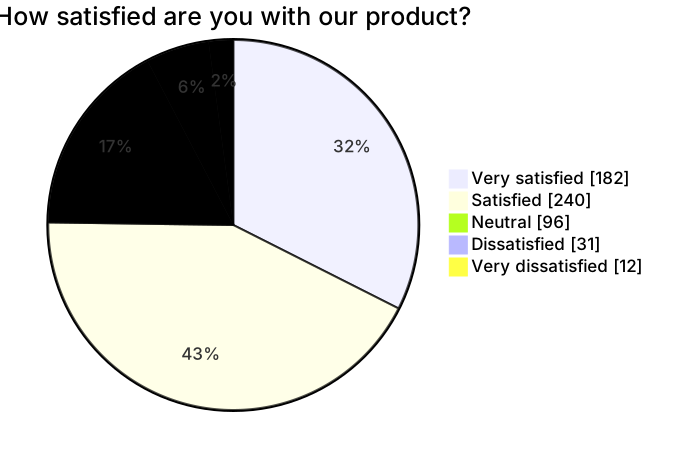
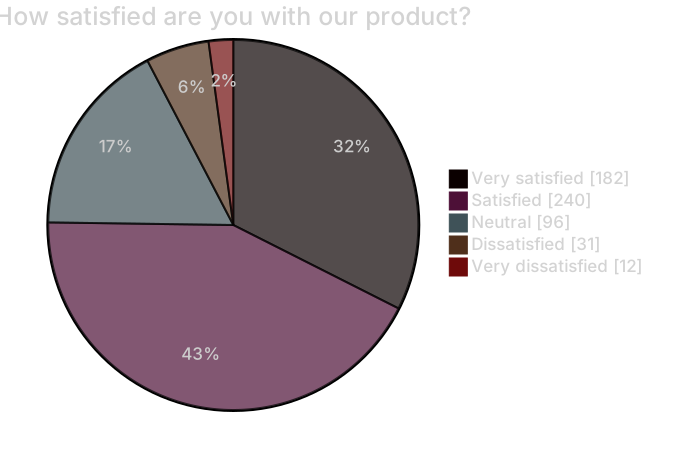
pie showData
    title How satisfied are you with our product?
    "Very satisfied" : 182
    "Satisfied" : 240
    "Neutral" : 96
    "Dissatisfied" : 31
"Very dissatisfied" : 12About this template
Turn survey results into a chart in seconds. Mermaid calculates percentages from raw counts and showData prints the counts in the legend for transparency.
How to customise it
- Replace categories with your answer options
- Remove showData to hide counts
- Pick a theme that matches your report
This template is a Mermaid pie chart. See the pie chart page for the full syntax reference and more examples.
Frequently asked questions
How do I use this survey results pie chart template?
Click "Use this template" to open it in the MermaidViewer editor. Edit the Mermaid code on the left and the diagram updates instantly. No account is needed.
Can I export the template as an image?
Yes. In the editor use Export to download PNG, SVG or PDF, or copy the image to your clipboard. You can also copy the code as a Markdown block for GitHub, GitLab or Notion.
Can AI customise this template for me?
Yes. Open the AI assistant (Ctrl/Cmd+K) and describe the change, for example "Replace categories with your answer options". The updated diagram streams into the editor.