If the plan has to survive a pull request, this is how to make a gantt chart in mermaid without babysitting a spreadsheet. You write a title, a date format, a few sections, and one line per task. Mermaid draws the bars. When a date slips, you change a duration and the tasks that say after move with it. The syntax catalog lives on the mermaid gantt chart page. This guide builds one plan from an empty file, then shows the mistakes that make the bars land on the wrong week.
A Gantt chart answers "when, in what order, and what is blocked." It is a weak tool for brainstorming and a strong tool for a roadmap you will edit again. Put it in the repo next to the milestone it describes.
The three lines every chart needs
Every chart starts the same way. The keyword is gantt. Then a title. Then dateFormat, which tells Mermaid how to read the dates you type. If the format and the dates disagree, tasks jump to 1970 or the parse fails, and both failures look like a layout bug.


gantt
  title Plan
  dateFormat YYYY-MM-DD
  section Build
  Design :a1, 2026-03-02, 5d
Build :after a1, 10dRead the task line from left to right. Design is the label people see. After the colon, a1 is the id other tasks will use. 2026-03-02 is the start. 5d is the duration. Build has no start date of its own. after a1 means "start when Design ends," and 10d is how long it runs.
The space before the colon matters less than people fear. The colon is what separates the label from the metadata. What does matter is an id with no spaces. a1 is a good id. design task is not an id, it is a second label, and the parser will not treat it as a dependency target.
dateFormat YYYY-MM-DD matches ISO dates. Use that unless you are copying a chart from a region that writes DD-MM-YYYY. Pick one format per file. Mixing 2026-03-02 and 03/02/2026 in one chart is a reliable way to shift a launch by a month.
Sections, status, and the axis
section is a band on the chart. Use it for a phase or a team, whichever question the reader will ask. A roadmap with Discovery, Design, Development, and Release is easy to scan. A roadmap with one section called Tasks is a list with extra decoration.
Status tags sit with the id. done paints a finished bar. active marks the work in progress. crit marks the bar you want eyes on, usually the critical path or a slip. You can combine a tag with an id: :done, d1, 2026-01-05, 7d.
axisFormat controls the tick labels, using the same tokens as common date libraries. %b %d gives a short month and day, which fits a quarter. A chart that runs two years wants %Y or the labels collide.
excludes weekends drops Saturday and Sunday from the scale so a 5d task means five weekdays. Milestones still sit on the date you wrote. If your team works Sunday, do not turn this on and then argue with the picture. There is also excludes sunday when only one day is off. Add the line under dateFormat, before the first section.
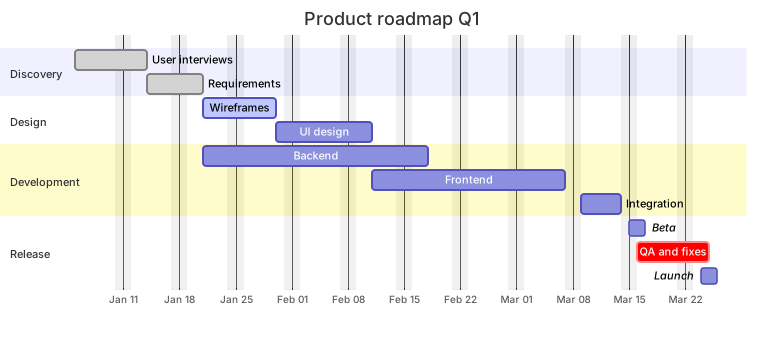
Here is a quarter plan with those pieces. The same chart is the project roadmap template if you want a preview you can edit immediately.
gantt
  title Product roadmap Q1
  dateFormat YYYY-MM-DD
  axisFormat %b %d
  excludes weekends
  section Discovery
    User interviews      :done, d1, 2026-01-05, 7d
    Requirements         :done, d2, after d1, 5d
  section Design
    Wireframes           :active, s1, after d2, 7d
    UI design            :s2, after s1, 8d
  section Development
    Backend              :b1, after d2, 20d
    Frontend             :f1, after s2, 18d
    Integration          :i1, after f1, 5d
  section Release
    Beta                 :milestone, m1, after i1, 0d
    QA and fixes         :crit, q1, after i1, 7d
Launch :milestone, m2, after q1, 0dA few readings that are easy to miss. Backend starts after d2, so it overlaps design. That is legal and often true: API work can start from the requirements while the UI is still in Figma. Frontend waits for UI design. Integration waits for frontend. QA is marked crit because it is the squeeze before launch. Beta and Launch are milestones, so their duration is 0d. A milestone with a five-day duration looks like a task and people will ask who owns those five days.
Dependencies that stay honest
Give every task an id if anything else will refer to it. Then use after id instead of a hard-coded start. The payoff shows up the first time interviews run long. You change d1 from 7d to 10d and requirements, design, and everything downstream shift. If you typed calendar dates on every line, you get to edit twelve dates and you will miss one.
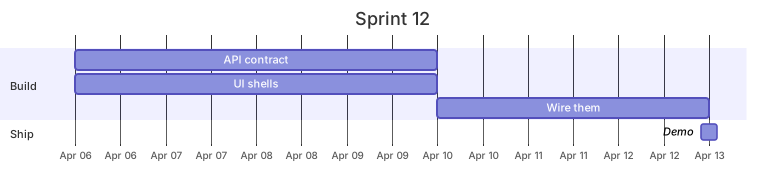
A task can wait on more than one predecessor. List the ids after the word after, then the duration.
gantt
  title Sprint 12
  dateFormat YYYY-MM-DD
  axisFormat %b %d
  section Build
    API contract     :a1, 2026-04-06, 4d
    UI shells        :a2, 2026-04-06, 4d
    Wire them        :a3, after a1 a2, 3d
  section Ship
Demo :milestone, m1, after a3, 0dWire them starts when both the contract and the shells are done. If you write after a1, 3d and forget a2, the chart is still valid and the plan is a lie. Say the dependency out loud while you type the id.
You can also write an end date instead of a duration: 2026-04-06, 2026-04-10. Durations are easier to maintain. End dates are useful when the constraint is a real calendar event, like a conference on a fixed Friday. Mix them on purpose. A launch milestone with after q1 plus a task that also has a fixed date will overlap in ways you should look at, because the fixed date will not move when the predecessor slips.
todayMarker off hides the vertical line Mermaid draws on today's date. Turn it off for a historical plan or a screenshot that should look the same next month. Leave it on when the chart is a status page.
How long the labels can be
The label is everything before the colon. Colons inside the label break the split. If the task is "Design: mobile", the parser thinks the metadata starts at mobile. Rename it to "Design mobile" or "Mobile design". Slashes and commas in labels are safer than colons, and they still clutter the axis. Keep labels to a few words. Put the ticket id in the id slot if you need it, or keep a table under the chart.
| Chart id | Ticket | What done means |
|---|---|---|
| d1 | RES-14 | Five interviews written up |
| d2 | RES-15 | Scope note merged |
| m2 | REL-2 | Production flag on |
That table is the part a Gantt chart is bad at: acceptance. The bar says the work has a length. The table says what finished means. I keep both in the same Markdown file so they change together.
A working rhythm
- Write the title as the question the chart answers, such as "Q1 roadmap" or "Migration weekend."
- Set
dateFormat YYYY-MM-DDand, if you plan in weekdays,excludes weekends. - Add one section per phase. Four sections is plenty. Eight sections means you wanted a portfolio of charts.
- Add tasks with ids, a start or an
after, and a duration ind(days) or a number of days Mermaid understands, such as1wfor a week. - Mark milestones with
milestoneand0d. - Tag
done,active, andcritonly for the bars a reader should notice. A chart where every bar iscrithas no critical path. - Open it in the editor and read the overlaps. An overlap you did not intend is the bug.
Paste a failing chart into the syntax error guide workflow: the message usually names the line, and the line is usually a date that does not match dateFormat, or a task that lost its colon.
Mistakes that move the bars
Forgetting `dateFormat`. Mermaid still tries to parse dates. The result is a chart that renders and is wrong. Put the format on line three and stop thinking about it.
Dependencies without ids. Build :after Design, 10d feels natural and fails, because Design is a label. The id is the token you set after the colon on the earlier task. Labels can change. Ids should stay stable so other lines do not rot.
A milestone with a real duration. Launch :milestone, m2, 2026-03-20, 2d draws a bar. If you wanted a diamond on a date, use 0d. If you wanted a two-day launch task, drop the word milestone.
Weekends excluded, then a Saturday start. excludes weekends plus a task that starts on Saturday makes the start snap to the next working day. That can be what you want. It can also shift a deploy past a freeze. Look at the first bar after you add the excludes line.
Using the chart as a staffing plan. A 20-day backend bar does not say whether that is one person or four. If the argument is capacity, write the assumption under the chart: "Backend is one engineer." Otherwise the picture will be used in a planning meeting as evidence you never offered.
Too many tasks. Forty bars in one fence become a stripe. Split by team, or keep the roadmap at the phase level and put the sprint somewhere else. A Gantt chart that needs horizontal scrolling has stopped being a communication tool.
Hand-editing dates after every slip. If you are typing new start dates each Monday, you skipped after. Go back and thread the chain. Leave fixed dates only on events the outside world owns: a conference, a contract end, a legal deadline.
A broken line looks like this. It is text on purpose, because it should not render:
gantt
  title Broken
  dateFormat YYYY-MM-DD
  section Build
  Design: mobile :a1, 03/02/2026, 5d
The label contains a colon, and the date is month-first while the format is year-first. Fix the label, fix the date, then render it.
What to leave off
Color is the first thing people add and the last thing that helps. crit, done, and active already carry status. Extra classDef styles on a Gantt chart fight the theme, especially in dark mode. If a stakeholder needs a brand color, export a PNG from the editor for that one meeting and keep the source plain.
Exact hours are the second temptation. Mermaid can do times if dateFormat includes them. A roadmap does not need 2026-03-02 09:30. The moment you add hours, every bar is a lie by Wednesday. Stay in days until you are planning a cutover window, and then make a second, smaller chart for that weekend only.
Owners' names in the label get stale. Put ownership in the section ("Design", "Platform") or in the table under the chart. A bar labeled "Alex fixes billing" is awkward the week Alex is on leave, and the history of the file becomes a personnel record you did not mean to publish.
Keeping the plan next to the work
Check the chart in like code. A pull request that moves the beta milestone should show a one-line diff on the milestone, plus the tasks whose durations changed. Reviewers can argue with a diff. They cannot argue with a screenshot pasted into Slack and lost.
Update tags when status changes. active on a task that finished two weeks ago trains people to ignore the chart. If nobody will update tags, leave them off and let the dates speak. A quiet chart that is true beats a decorated chart that is fiction.
When you only have a paragraph of intent ("about three weeks of discovery, then build"), let the AI diagram generator draft the first fence. Replace the made-up dates with yours before you share it. Models are cheerful about timelines. Your dateFormat will not save you from a fantasy start date.
When a Gantt chart is the wrong page
Use this chart for dated work with dependencies. Use a timeline when you have eras and no durations. Use a flowchart when the question is a decision, such as "what do we do if the beta fails." Use a state diagram when one object moves through statuses. Linking those pictures from the roadmap file is better than forcing their stories into bars.
If you want a worked quarter you can fork, open the project roadmap template and change the title and the first date. Everything that says after will follow. That is the whole trick behind how to make a gantt chart in mermaid and still trust it a month later: stable ids, durations, and as few absolute dates as the outside world forces on you.
Frequently asked questions
How do I start a Mermaid Gantt chart?
The first lines are gantt, a title, and dateFormat. Then add section blocks and one task per line.
How do I show that a task depends on another?
Give the first task an id with the colon syntax and reference it with after taskId on the next task.
Can I hide weekends?
Yes. Add excludes weekends under the dateFormat line. Milestones still land on the dates you set.