Basic quadrant chart example
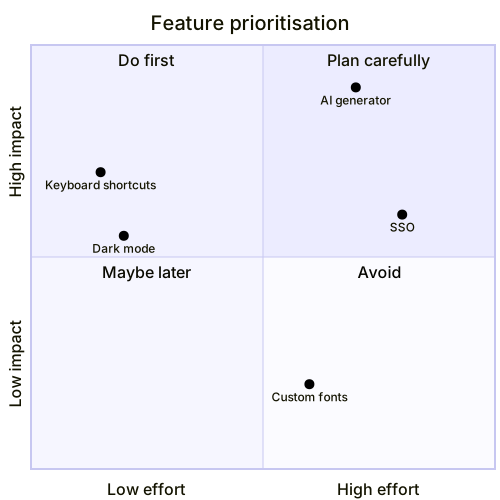
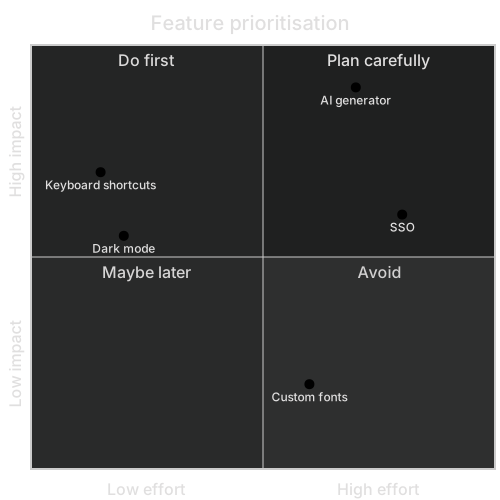
mermaid
quadrantChart
    title Feature prioritisation
    x-axis Low effort --> High effort
    y-axis Low impact --> High impact
    quadrant-1 Plan carefully
    quadrant-2 Do first
    quadrant-3 Maybe later
    quadrant-4 Avoid
    Dark mode: [0.2, 0.55]
    AI generator: [0.7, 0.9]
    SSO: [0.8, 0.6]
    Keyboard shortcuts: [0.15, 0.7]
Custom fonts: [0.6, 0.2]Quadrant charts place items on two axes split into four quadrants — the classic 2×2 matrix. They're used for effort/impact prioritisation, competitor positioning, risk matrices and the Eisenhower urgent/important grid.
In Mermaid you name the axes and quadrants, then list points with x and y values between 0 and 1.
When to use a quadrant chart
- Effort vs impact prioritisation
- Competitive landscape maps
- Risk likelihood vs severity
- Eisenhower matrices
Quadrant Chart syntax reference
| Syntax | What it does |
|---|---|
quadrantChart | Start a quadrant chart. |
x-axis Left --> Right | Label both ends of the x-axis. |
y-axis Bottom --> Top | Label both ends of the y-axis. |
quadrant-1 … quadrant-4 | Labels: 1 top-right, 2 top-left, 3 bottom-left, 4 bottom-right. |
Point: [x, y] | Plot a point; x and y range from 0 to 1. |
Quadrant Chart examples
Eisenhower matrix
Urgent vs important tasks.
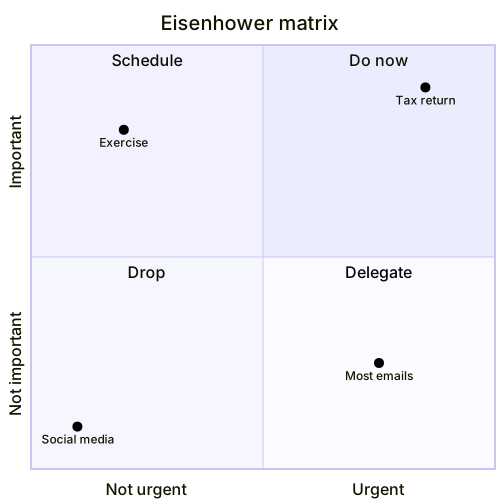
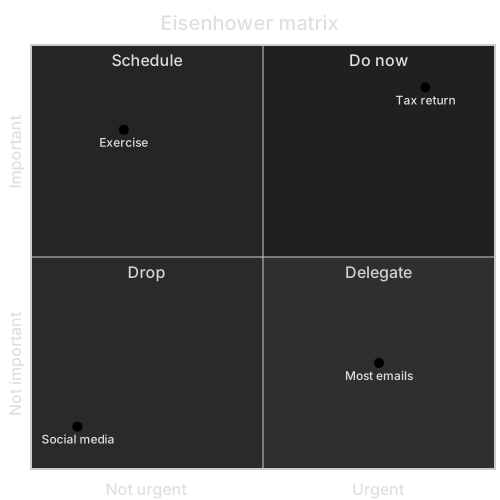
mermaid
quadrantChart
    title Eisenhower matrix
    x-axis Not urgent --> Urgent
    y-axis Not important --> Important
    quadrant-1 Do now
    quadrant-2 Schedule
    quadrant-3 Drop
    quadrant-4 Delegate
    Tax return: [0.85, 0.9]
    Exercise: [0.2, 0.8]
    Most emails: [0.75, 0.25]
Social media: [0.1, 0.1]Tips and best practices
- Remember the quadrant numbering starts top-right and goes counter-clockwise.
- Keep point labels short; long labels overlap.
- Values must be between 0 and 1 — normalise your data first.
Generate a quadrant chart with AI
Not sure where to start? Describe what you need and the AI quadrant chart generator writes the Mermaid code for you. Try prompts like:
- “Competitor analysis of note-taking apps by price and features”
- “Risk matrix for a software launch”
- “Marketing channels by cost and reach”
Quadrant Chart templates
Quadrant Chart FAQ
Which quadrant is quadrant-1 in Mermaid?
quadrant-1 is top-right, quadrant-2 top-left, quadrant-3 bottom-left and quadrant-4 bottom-right.
What range do point coordinates use?
Both x and y must be between 0 and 1, where 0 is the left/bottom and 1 the right/top of the chart.