Basic radar chart example
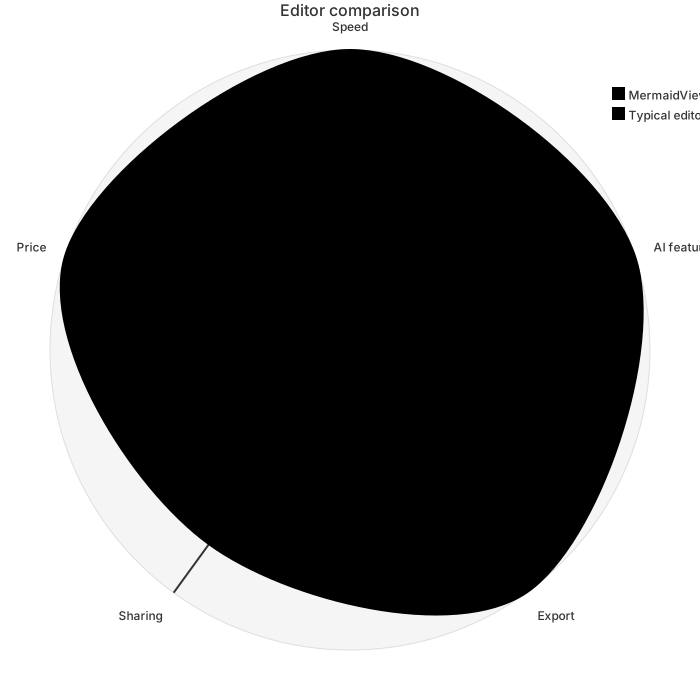
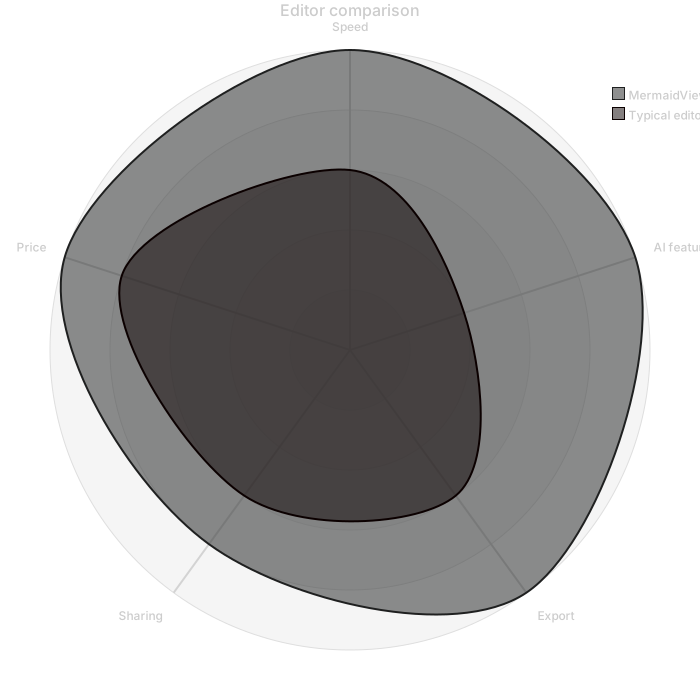
mermaid
radar-beta
    title Editor comparison
    axis speed["Speed"], ai["AI features"], export["Export"], share["Sharing"], price["Price"]
    curve a["MermaidViewer"]{5, 5, 5, 4, 5}
    curve b["Typical editor"]{3, 2, 3, 3, 4}
    max 5
min 0Radar charts (also called spider charts) compare several items across the same set of dimensions. Each axis is a dimension, and each item is drawn as a polygon.
They're popular for skill matrices, product comparisons and performance reviews where the overall shape tells the story.
When to use a radar chart
- Team skill matrices
- Product and competitor comparisons
- Game character stats
- Self-assessments
Radar Chart syntax reference
| Syntax | What it does |
|---|---|
radar-beta | Start a radar chart. |
axis id["Label"], … | Define the axes (dimensions). |
curve id["Label"]{1, 2, 3} | A data series; one value per axis. |
max 5 / min 0 | Scale limits. |
graticule polygon | Use polygon grid lines instead of circles. |
Radar Chart examples
Tips and best practices
- Use the same scale for every axis.
- Compare at most three or four curves at once.
- Order axes so related dimensions sit next to each other.
Generate a radar chart with AI
Not sure where to start? Describe what you need and the AI radar chart generator writes the Mermaid code for you. Try prompts like:
- “Skills comparison of three job candidates”
- “Smartphone comparison across camera, battery, price, display and performance”
- “Personal wellbeing wheel”
Radar Chart templates
Radar Chart FAQ
How many values does each radar curve need?
One value per axis, in the same order the axes are declared.