AI radar chart generator
AI radar chart generator that turns scores across a few axes into a Mermaid radar chart.
By MermaidViewer editorsPublished Updated
Example prompts for a radar chart
- “Skills comparison of three job candidates”
- “Smartphone comparison across camera, battery, price, display and performance”
- “Personal wellbeing wheel”
What a Mermaid radar chart looks like
Example radar chart
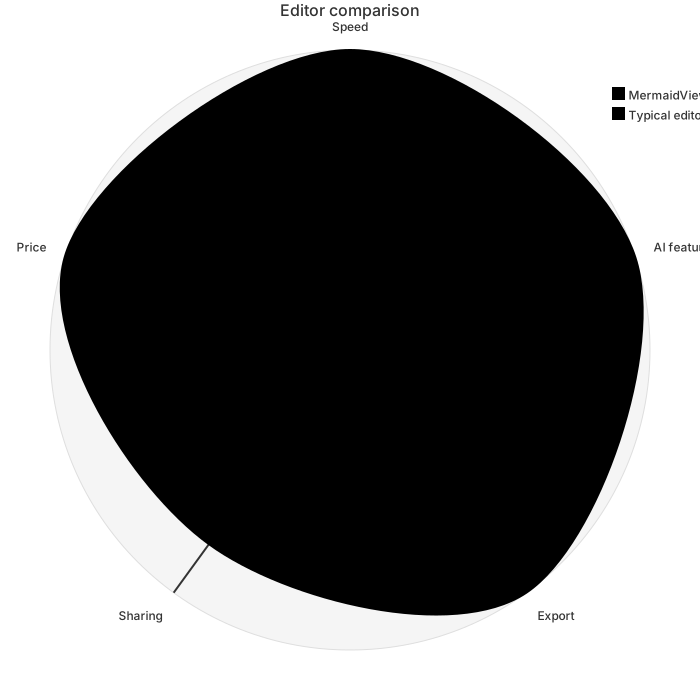
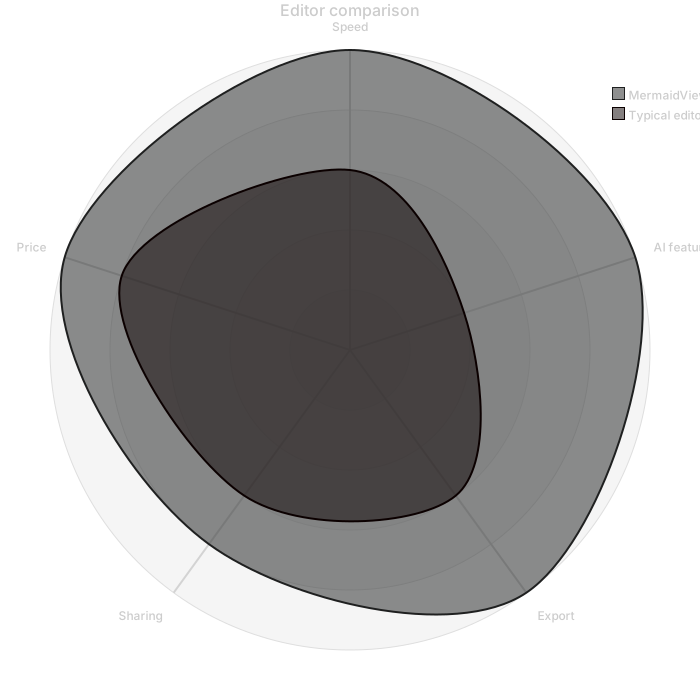
radar-beta
    title Editor comparison
    axis speed["Speed"], ai["AI features"], export["Export"], share["Sharing"], price["Price"]
    curve a["MermaidViewer"]{5, 5, 5, 4, 5}
    curve b["Typical editor"]{3, 2, 3, 3, 4}
    max 5
min 0Want to write it by hand? See the full Mermaid radar chart syntax and examples, or browse templates.
Every axis has to share a scale, and an ai radar chart generator will still plot a 1-to-5 skill next to a salary in the thousands if you let the axes mean different units. Coffee shops, neighborhoods, course workloads: the chart is a polygon per series, and a spike means a high score on a shared ruler. The widget above writes radar-beta. This page is about axes, value counts, and the one-number edits that keep a polygon honest.
Comparisons it can plot
Two or three series with the same axes usually come back as two or three curve lines. Axis labels stick when you give them short names. A maximum and a minimum stick when you say max 5 and min 0. The order of values follows the order of axes if you write the scores in that order and repeat the axis names in the prompt. A title sticks. A polygon grid, if you ask for graticule polygon, is optional and easy to add later by hand.
The chart is good at a small comparison you already scored. It is bad at inventing fair scores. If you do not know whether the north shop's wifi is a 3 or a 4, the model will pick one with confidence. Treat generated scores as placeholders unless you typed the digits. The radar chart syntax is axis, then curve id["Label"]{values}, then max and min. One value per axis, no extras, no omissions. That count is the check.
Polygons that compare different rulers
The value list is shorter than the axis list, and the series shifts sideways. A shop looks weak on seats when the 2 you wrote was the wifi score. Or the list is longer, and the parser stops. Axes arrive with different implied scales: price as dollars, atmosphere as stars, and both drawn to the same rim. A maximum below a value clips the spike or errors. More than four curves turn the middle of the chart into ink. The model will add a fourth and a fifth "for context."
Axis ids with spaces fail. Labels get written as ids. The keyword comes back as xychart or pie because those are more common charts. Negative scores appear for "below average" and then sit outside a minimum of 0. Order of axes is shuffled, so the spoken order in the meeting does not match the clockwise order on the picture. Put related axes next to each other in the prompt or the polygon becomes a star for no reason.
Axes and digits the prompt should lock
Say the ruler once, then the scores.
- The title.
- The keyword radar-beta.
- Each axis id and label, in clockwise order.
- The minimum and the maximum, and the statement that every axis uses them.
- Each series name and one number per axis, in that same order.
- A ban on extra series and on units other than the shared score.
- "Do not invent scores" if you have supplied every digit.
The skills radar template compares people across frontend, backend, DevOps, design, and communication. Generate a new chart for shops, neighborhoods, or courses. Open the template when you are actually looking at team skills and you will replace the sample numbers. The prompt guide covers AI edit. The useful edit here is "one value per axis, max 5, delete the extra curve."
Three prompts
- Radar chart titled Two coffee shops. Axes in order: beans, wifi, seats, price, noise. Score 1 to 5 where 5 is better for the drinker, and price 5 means affordable. Max 5, min 0. Curve North: 4, 3, 5, 4, 2. Curve South: 5, 4, 2, 3, 4. Do not add a third shop. Do not use dollars.
- Radar chart titled Two neighborhoods for a renter. Axes: transit, groceries, noise, rent, parks. Score 1 to 5, and 5 on rent means more affordable. Max 5, min 0. Curve Market: 5, 4, 2, 2, 3. Curve Ridge: 3, 3, 4, 4, 5. Exactly two curves. Keep axis order.
- Radar chart titled Two courses this term. Axes: reading, labs, exams, group work. Score 1 to 5 for weekly load, 5 means heavier. Max 5, min 0. Curve Biology: 3, 5, 4, 2. Curve Writing: 5, 1, 3, 4. No grade-point axis. No third course.
Shops on one ruler
North has the seats and a noisy room. South has the beans and the wifi, and fewer seats. Price is a score, not a bill. Both polygons can be compared because both use 0 to 5.
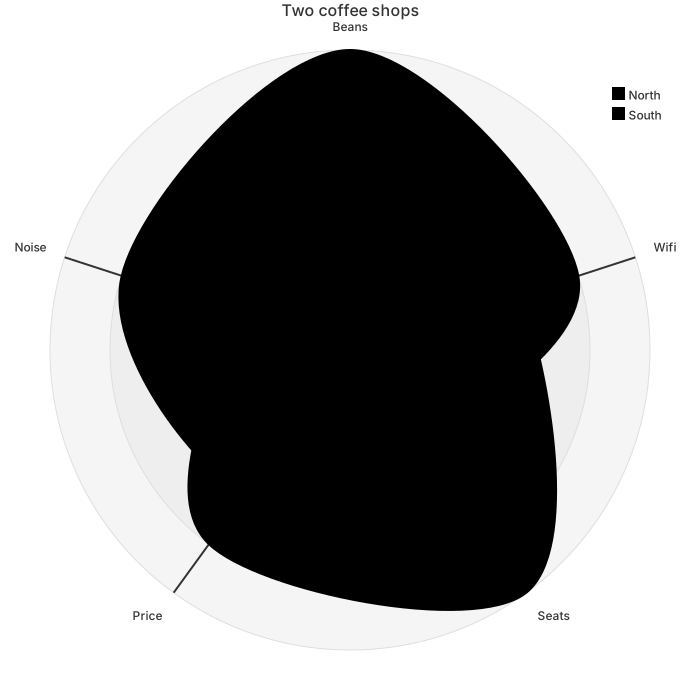
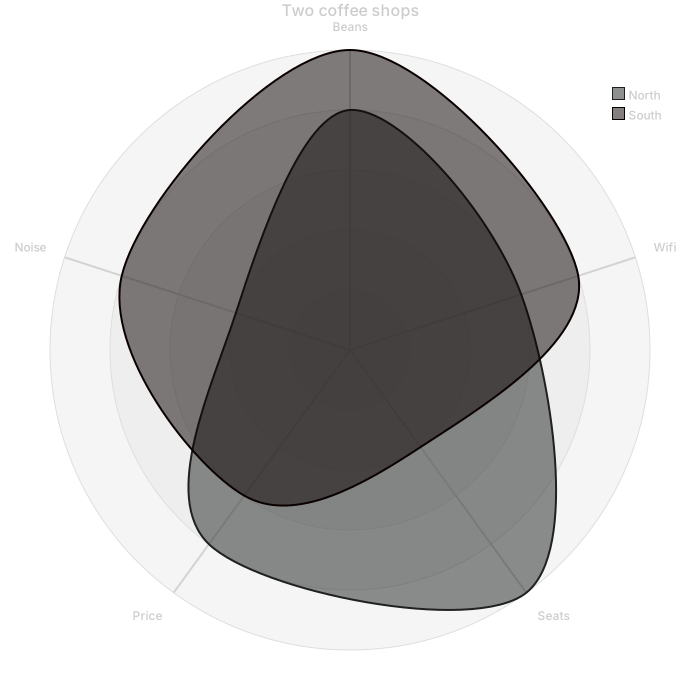
radar-beta
    title Two coffee shops
    axis beans["Beans"], wifi["Wifi"], seats["Seats"], price["Price"], noise["Noise"]
    curve north["North"]{4, 3, 5, 4, 2}
    curve south["South"]{5, 4, 2, 3, 4}
    max 5
    min 0
Open the editor and change North's noise from 2 to 3 if you went back on a quieter afternoon. Count the numbers inside the braces before you save. Five axes, five numbers. A helpful extra comma will shift price into the noise slot and the chart will still look plausible.
Putting a shifted series back on its axes
Use an AI edit when the counts disagree or a third series appeared. "radar-beta. Axes beans, wifi, seats, price, noise. Max 5, min 0. North is 4, 3, 5, 4, 2. South is 5, 4, 2, 3, 4. Delete any other curve. Every axis uses the same 0 to 5 score." Aligning the lists is worth a generation.
Edit a digit by hand when the axes are already in the right order. Change 2 to 3 inside North's braces. Rename a curve. Raise max only if you truly changed the scale for every axis and every curve. Hand editing stays free. Do not raise the maximum to fit a salary you should not have plotted.
A parse error is usually an axis id with a space, a curve whose braces do not match the axis count, or a missing comma between axes. Count, then fix the line in the editor. If the model returned a bar chart, an AI edit that names radar-beta is faster than rebuilding five axes from memory under pressure. Once the keyword is right, further number changes are typing.
Five uses total
The complimentary allowance is five AI uses in total, not five per day. The account and the IP draw from that same pool, shared with every other generator. A radar chart with supplied digits often works the first time. It needs a second pass when a series is short one number or a pie chart comes back. Use the pass. Then change scores by hand.
On pricing, Starter is $6.99 a month for 500 AI conversations a month, and Pro is $11.99 a month for unlimited AI under fair use. Fair use limits automated floods. Hand editing stays free after the five uses are spent, and export does too. A skills chart can be revised after each review cycle by editing braces only.
A bar chart is easier to read for one series across time. A radar chart is the comparison of a few profiles across the same axes. The AI diagram generator index links the bar chart page. Stay here when the polygon is the point.
Frequently asked questions
How do I generate a radar chart with AI?
Describe the radar chart you need in the box above and click Generate. The AI writes valid Mermaid radar chart code that renders instantly, and you can open it in the editor to refine it.
Is the AI radar chart generator free?
You can try it free: 5 AI generations in total, not per day, with no sign-up. Starter includes 500 AI conversations a month and Pro is unlimited. Manual editing stays available, and every plan can still download a PNG. JPG, SVG and PDF are on Pro.
Can I edit the generated radar chart?
Absolutely. The output is plain Mermaid code — edit it by hand in the live editor, or ask the AI for changes in natural language.