AI XY Chart (Bar & Line) generator
Describe your xy chart (bar & line) in plain English and get editable Mermaid code instantly. Bar and line charts with categorical or numeric axes.
Example prompts for a xy chart (bar & line)
- “Quarterly revenue vs target for 2026”
- “Average page load time per release”
- “Daily steps over a week”
What a Mermaid xy chart (bar & line) looks like
Example xy chart (bar & line)
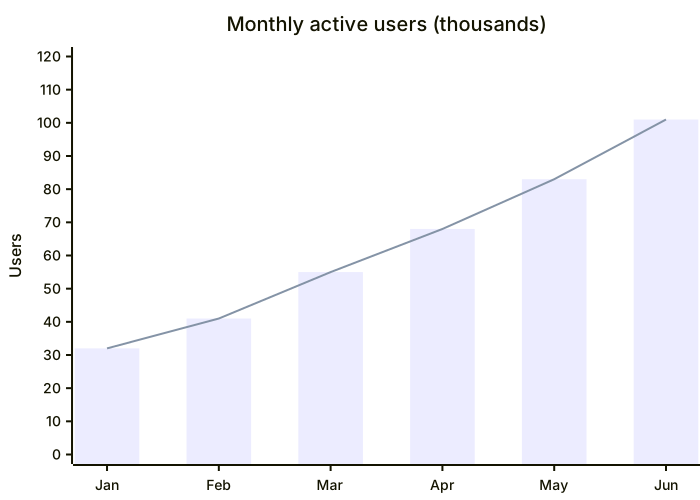
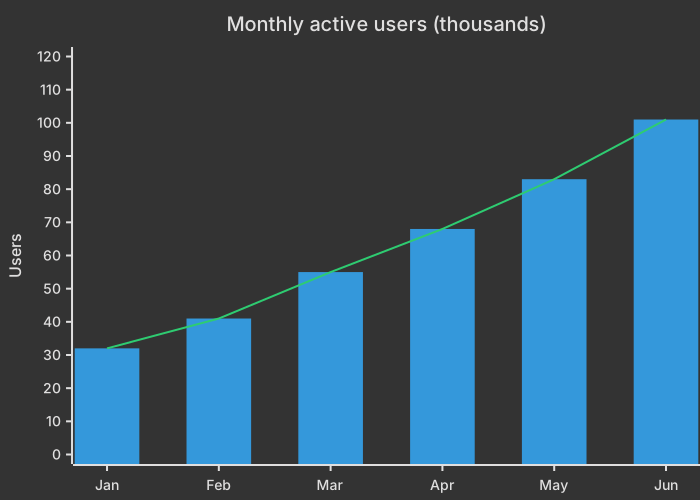
xychart
    title "Monthly active users (thousands)"
    x-axis [Jan, Feb, Mar, Apr, May, Jun]
    y-axis "Users" 0 --> 120
    bar [32, 41, 55, 68, 83, 101]
line [32, 41, 55, 68, 83, 101]Want to write it by hand? See the full Mermaid xy chart (bar & line) syntax and examples, or browse templates.
Frequently asked questions
How do I generate a xy chart (bar & line) with AI?
Describe the xy chart (bar & line) you need in the box above and click Generate. The AI writes valid Mermaid xy chart (bar & line) code that renders instantly, and you can open it in the editor to refine it.
Is the AI xy chart (bar & line) generator free?
You can try it free — 5 AI generations in total, no sign-up needed. Starter includes 500 AI conversations a month and Pro is unlimited. Manual editing and export stay free after that.
Can I edit the generated xy chart (bar & line)?
Absolutely. The output is plain Mermaid code — edit it by hand in the live editor, or ask the AI for changes in natural language.