Basic xy chart (bar & line) example
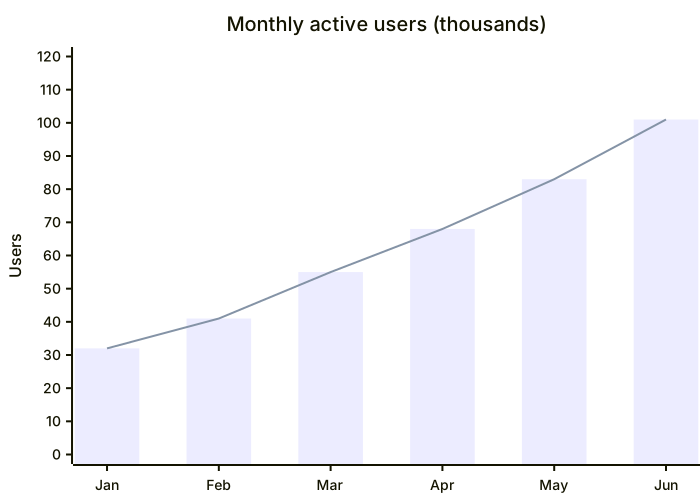
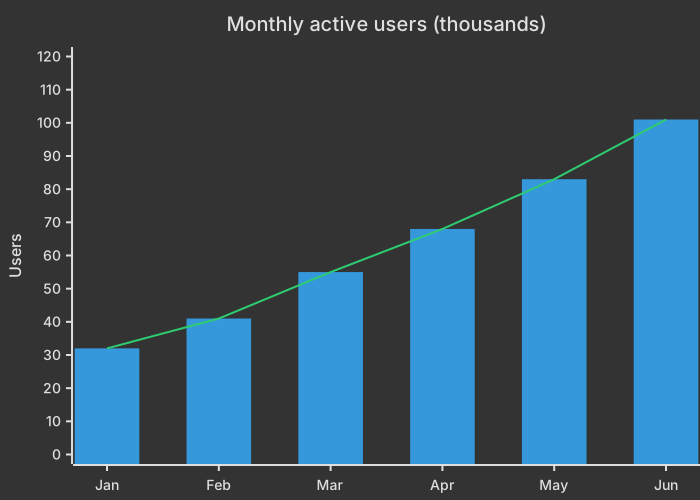
xychart
    title "Monthly active users (thousands)"
    x-axis [Jan, Feb, Mar, Apr, May, Jun]
    y-axis "Users" 0 --> 120
    bar [32, 41, 55, 68, 83, 101]
line [32, 41, 55, 68, 83, 101]Mermaid XY charts render bar charts, line charts or both on the same axes. They're great for metrics in reports and READMEs: monthly revenue, benchmark results, response times and growth curves.
You define the x-axis categories, the y-axis range and one or more bar or line series, and Mermaid draws a clean, themed chart.
When to use a xy chart (bar & line)
- Monthly metrics and KPIs
- Benchmark comparisons
- Growth and trend charts
- Release-over-release performance
XY Chart (Bar & Line) syntax reference
| Syntax | What it does |
|---|---|
xychart | Start an XY chart (older versions: xychart-beta). |
xychart horizontal | Draw bars horizontally. |
title "Text" | Chart title. |
x-axis [a, b, c] | Categorical x-axis. |
x-axis "Label" 0 --> 100 | Numeric x-axis with a range. |
y-axis "Label" 0 --> 500 | Y-axis label and range. |
bar [..] / line [..] | Add a bar or line series. |
XY Chart (Bar & Line) examples
Benchmark comparison
A horizontal bar chart comparing response times.
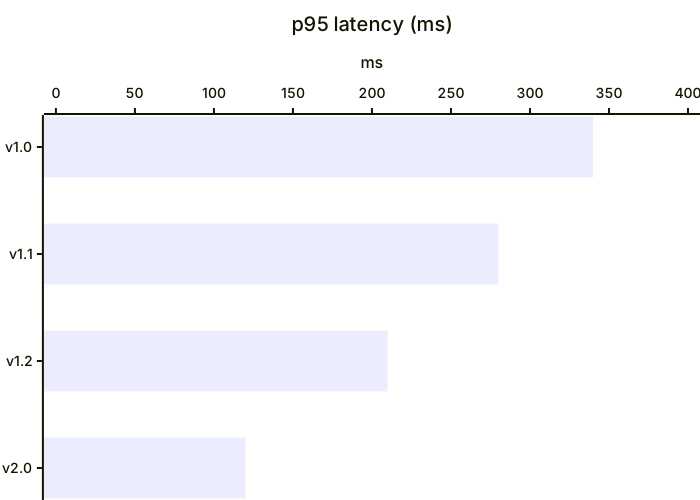
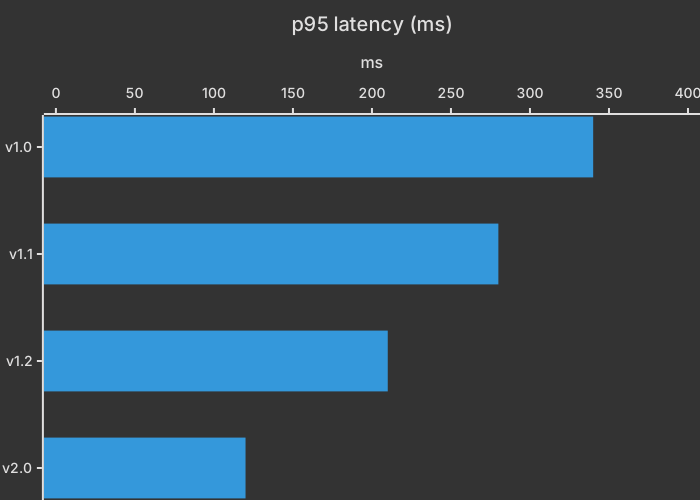
xychart horizontal
    title "p95 latency (ms)"
    x-axis [v1.0, v1.1, v1.2, v2.0]
    y-axis "ms" 0 --> 400
bar [340, 280, 210, 120]Categories along the bottom and a number for each one are the job. A mermaid xy chart is a small bar chart you can paste into Markdown. It's not a spreadsheet, and it won't invent a scale you forgot to write. The form below is the one to keep.
The frame and the bars
xychart-beta opens the chart. title is the heading. x-axis [jan, feb, mar] lists the categories in order, inside brackets. y-axis "Signups" 0 --> 100 names the measure and sets the low and high ticks. bar [10, 20, 30] gives one height per category, in the same order as the x-axis.
The y scale is yours. If the largest bar is 30 and the axis runs to 100, the bars look short, which is correct when 100 is a real target and misleading when you picked 100 out of habit. Set the top a little above the largest value, or at the target you want people to see.
Match the lengths. Three categories want three bar values. A shorter bar list leaves a month with nothing to draw, and a reader won't know whether the month is zero or forgotten. A zero is 0 in the list, on purpose.
Keep categories as simple tokens, the way jan, feb, mar is written. If you need a longer label, look at how cramped the axis gets with three words. Four to eight bars is a good range. A year of daily bars is a different tool.
This chart shows size at each category. It doesn't show a part-to-whole unless the reader does the addition. If the question is "what share is billing," use a pie. If the question is "did signups rise," the bars are right.
Worked example
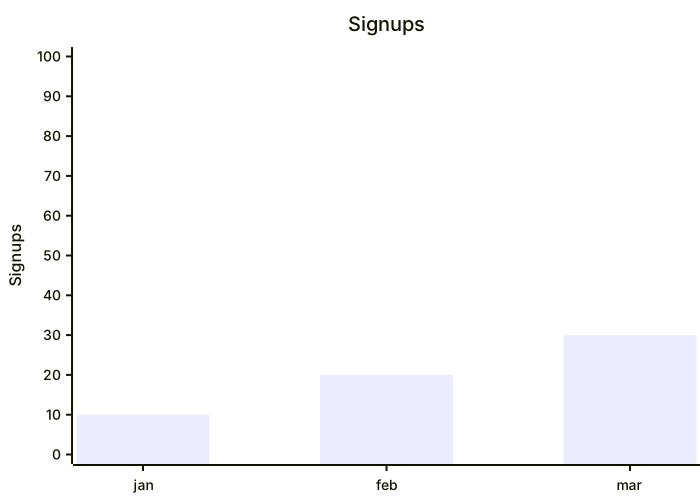
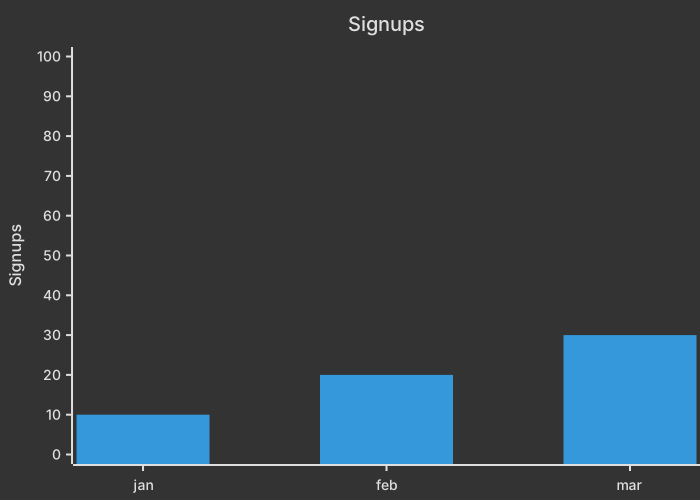
Signups for the first quarter climb from 10 to 30. The axis runs to 100 because that's the quarter's monthly target, not because 100 is a default.
xychart-beta
    title Signups
    x-axis [jan, feb, mar]
    y-axis "Signups" 0 --> 100
bar [10, 20, 30]January is the first number, March is the last. The order is the order of the x-axis list, not a sort. If you insert apr at the front of the axis and leave the bar list alone, April inherits January's 10 and every month lies. Change both lists in the same edit.
The title says Signups and the y-axis says Signups. That repeat is fine on a single series. It gets noisy if you later add a second measure. Keep one series until the chart has a reason to compare two. A second series needs a legend the reader can see, and a small embedded chart often can't spare the room.
The gap between 30 and the top of the axis is the unread target. If the target changed to 40, change 100 to 40 or the picture still says you're far short. The scale is a claim.
When this is the wrong diagram
A pie chart is the better picture when the numbers are shares of one total. A Gantt chart is the better picture when a bar means a span of days. Use an XY chart when each slot has a magnitude and the slots are peers on one axis.
Common mistakes
- A
barlist that's shorter or longer than the x-axis list. Each category needs one number, in the same order, including an explicit0. - A y-axis with a title and no
0 --> 100scale. The frame of the chart is the scale. Set the top near the target or near the max value. - Categories in one order and values in another. The first value belongs to the first category. There's no name attached to a bar except by position.
- An axis top that makes every bar a stub, because 100 was left over from another chart. Pick the top from this dataset or from a stated target.
Where to go next
The AI XY chart generator will lay out categories from a sentence. Check the list lengths in the editor, and the cheat sheet has the axis form. The revenue bar template is the same chart aimed at money instead of signups.
The axis has to hold the largest bar
Set y-axis high enough for the biggest value, or the bar paints past the frame and the label looks like a bug. Categories on the x-axis stay in the order you want read, left to right. A month chart that starts with October because that was the row in the CSV will be read as a trend that is not there.
If you only have one number per slice and no order, a pie chart is the smaller picture. If the numbers are a flow between stages, use a Sankey. The revenue bar template is a starting file with the axis already declared.
Tips and best practices
- Set an explicit y-axis range so charts with different data stay comparable.
- Combine bar and line series to show a value and its trend or target.
- Quote titles and axis labels that contain spaces.
Generate a xy chart (bar & line) with AI
Not sure where to start? Describe what you need and the AI xy chart (bar & line) generator writes the Mermaid code for you. Try prompts like:
- “Quarterly revenue vs target for 2026”
- “Average page load time per release”
- “Daily steps over a week”
XY Chart (Bar & Line) templates
Bar and line chart showing monthly recurring revenue against a target line.
XY Chart (Bar & Line) FAQ
Can Mermaid make bar charts?
Yes. Use the xychart diagram with a bar series. You can add line series on the same chart and switch to horizontal bars with xychart horizontal.
Is it xychart or xychart-beta?
Newer Mermaid versions accept xychart; older ones require xychart-beta. Both work in MermaidViewer.