xychart
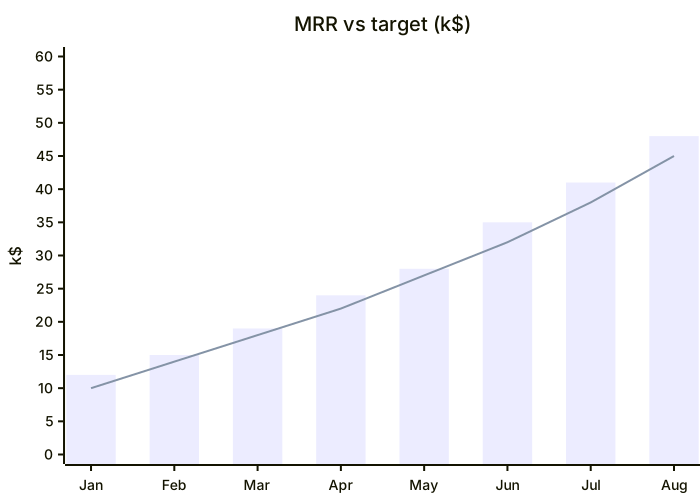
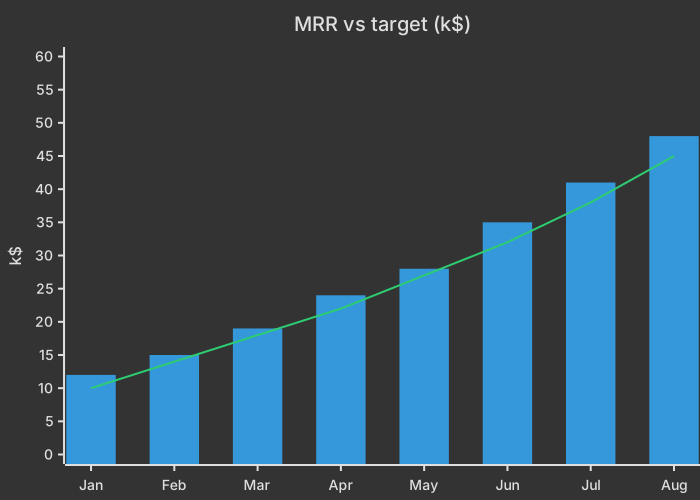
    title "MRR vs target (k$)"
    x-axis [Jan, Feb, Mar, Apr, May, Jun, Jul, Aug]
    y-axis "k$" 0 --> 60
    bar [12, 15, 19, 24, 28, 35, 41, 48]
line [10, 14, 18, 22, 27, 32, 38, 45]About this template
A simple, clean chart for investor updates and team dashboards. Bars show actual MRR while the line shows the target, so you can see at a glance whether you're ahead or behind plan.
How to customise it
- Update the months and values
- Remove the target line
- Switch to horizontal bars
This template is a Mermaid xy chart (bar & line). See the xy chart (bar & line) page for the full syntax reference and more examples.
Frequently asked questions
How do I use this monthly revenue bar chart template?
Click "Use this template" to open it in the MermaidViewer editor. Edit the Mermaid code on the left and the diagram updates instantly. No account is needed.
Can I export the template as an image?
Yes. In the editor use Export to download PNG, SVG or PDF, or copy the image to your clipboard. You can also copy the code as a Markdown block for GitHub, GitLab or Notion.
Can AI customise this template for me?
Yes. Open the AI assistant (Ctrl/Cmd+K) and describe the change, for example "Update the months and values". The updated diagram streams into the editor.