Basic sankey diagram example
sankey

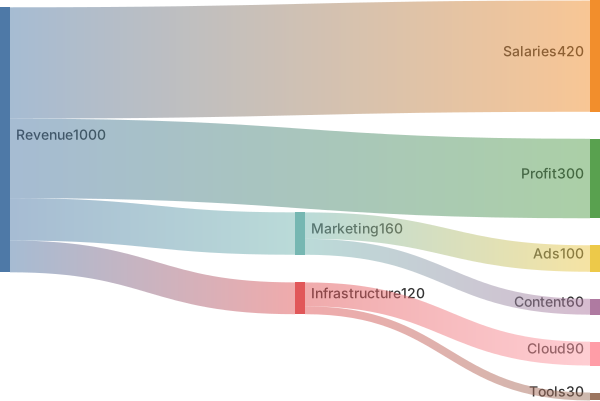
Revenue,Salaries,420
Revenue,Infrastructure,120
Revenue,Marketing,160
Revenue,Profit,300
Marketing,Ads,100
Marketing,Content,60
Infrastructure,Cloud,90
Infrastructure,Tools,30Sankey diagrams visualise flows: how much of something moves from one category to another. Link width is proportional to the value, so the biggest flows are obvious at a glance.
Mermaid uses a CSV-like format — source, target, value — which makes it easy to paste data from a spreadsheet or SQL query.
When to use a sankey diagram
- Budget and cash-flow breakdowns
- Marketing and signup funnels
- Energy and material flows
- User navigation paths
Sankey Diagram syntax reference
| Syntax | What it does |
|---|---|
sankey | Start a sankey diagram (older versions use sankey-beta). |
source,target,value | One flow per line, CSV style. |
"Name, with comma",target,5 | Quote names that contain commas. |
Empty lines | Allowed to visually group lines. |
Sankey Diagram examples
Signup funnel
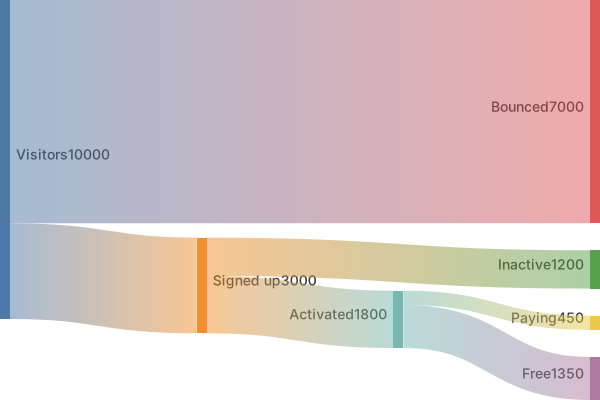
Where visitors drop off on the way to becoming customers.
sankey

Visitors,Signed up,3000
Visitors,Bounced,7000
Signed up,Activated,1800
Signed up,Inactive,1200
Activated,Paying,450
Activated,Free,1350Widths are the data. A mermaid sankey diagram draws a ribbon from a source to a target, and the ribbon's width is the number on that line. It's the right picture when a quantity splits and joins, and a poor picture when all you have is "then this happens." The syntax is a list of CSV rows under sankey-beta.
Rows, names, and conservation
Each line is Source,Target,10. Three fields, commas, no header. A header such as Source,Target,Value still parses, and it draws a ribbon from a node called Source to a node called Target. Delete it.
Use a single simple word for each node. The comma is the separator, so a name with a comma is a broken row. Spaces can sneak in from a spreadsheet export and become part of the name, which then fails to match the same word on the next line. Site and Site are two nodes. Type the names by hand if the export looks padded.
The diagram doesn't check that inflows match outflows. If 40 arrives at Site and 25 plus 15 leave, the picture looks like a split of the same stuff. If 50 leaves, the ribbons still draw, and the story is wrong. Add the numbers yourself before you publish. Units have to match too. Clicks on one row and dollars on the next share one width scale, which makes the dollar ribbon look huge or tiny for no honest reason.
Keep the chain short. Three stages are readable. Seven stages turn into a braid, and the labels sit on top of each other.
Worked example
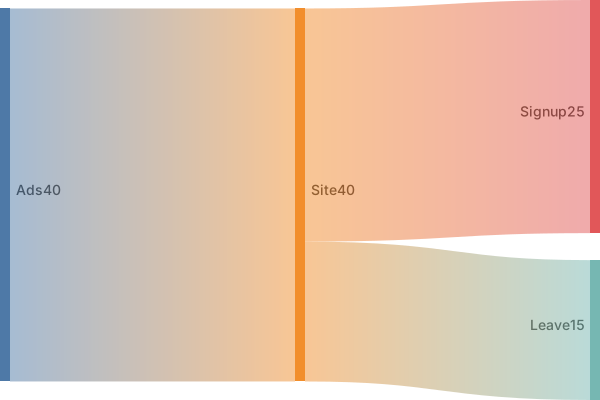
Ads send 40 people to the site. The site splits them into 25 signups and 15 who leave.
sankey-beta
Ads,Site,40
Site,Signup,25
Site,Leave,15Ads,Site,40 is the inflow. The next two rows are the split, and 25 plus 15 is 40, so the widths tell one conserved story. Signup isn't "better" because of color. It's wider because 25 is larger than 15. If you wanted Leave to look like a loss, the width already says that, as long as you don't also encode it with a second number somewhere else.
Reverse a row and the story reverses. Signup,Site,25 says signups flow back to the site. Read every row as a sentence with a direction. The first word is where the quantity comes from.
If you have a second source, add Email,Site,10 and then decide whether the split rows still describe the combined site traffic. A split that only accounts for the ads will no longer match the inflow. Either extend Signup and Leave, or keep the email path as its own chain. Round to whole numbers in a first version. A width of 25.5 is hard to check by eye, and the conservation story is the part reviewers get wrong.
When this is the wrong diagram
A flowchart is the better picture when the links have no amounts. A pie chart is the better picture when one total breaks into peer slices and nothing flows onward. Use a sankey diagram when the reader should compare widths along a path.
Common mistakes
- Leaving a header row in the file.
Source,Target,Valuebecomes a real ribbon between two bogus nodes. Start with the first data line. - Two spellings of one node,
Siteandsite, or a trailing space copied from a sheet. They won't join, and the flow splits across lookalike labels. - A reversed pair.
Signup,Site,25draws the opposite direction from the sentence you meant. The source is the first field. - Mixed units. A row in dollars next to a row in people uses one width scale, so the picture compares numbers that aren't comparable.
Where to go next
The AI sankey generator will draft rows from a funnel description. Add the widths in the editor and check that each split sums, and the cheat sheet has the CSV shape. The marketing funnel template is a longer path if ads-to-signup is too small.
Flows that add up
Each link is a quantity from one node to another. If 100 people enter "Visit" and the links out of Visit sum to 140, the chart is telling a story the spreadsheet does not. Make the outgoing numbers add up to the incoming number before you publish, or label the diagram as illustrative in the sentence above it.
Node names should be stages, not slogans. "Awareness" to "Purchase" is a funnel. "Synergy" to "Delight" is not a quantity. The marketing funnel template uses counts you can replace with yours.
Tips and best practices
- Make sure flows balance where it makes sense (inputs equal outputs) or the diagram will look lopsided.
- Keep node names identical across lines — Revenue and revenue are different nodes.
- Use quotes for any label containing a comma.
Generate a sankey diagram with AI
Not sure where to start? Describe what you need and the AI sankey diagram generator writes the Mermaid code for you. Try prompts like:
- “Household income to expenses flow”
- “Website traffic from channels to conversions”
- “Electricity generation by source to usage”
Sankey Diagram templates
Sankey Diagram FAQ
What format does a Mermaid sankey diagram use?
A CSV-like list with three columns: source, target and value. Each row creates a link whose width is proportional to the value.
Is it sankey or sankey-beta?
Recent Mermaid versions accept sankey; older versions required sankey-beta. MermaidViewer runs the latest Mermaid, so both work.