Basic treemap example
mermaid
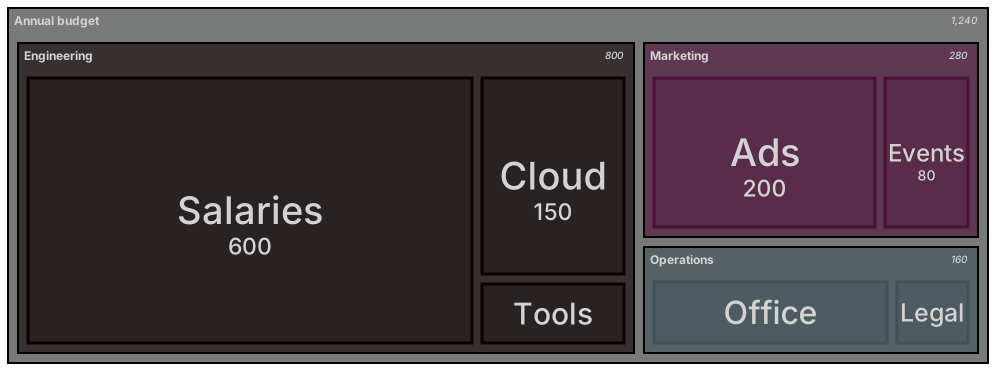
treemap-beta
"Annual budget"
    "Engineering"
        "Salaries": 600
        "Cloud": 150
        "Tools": 50
    "Marketing"
        "Ads": 200
        "Events": 80
    "Operations"
        "Office": 120
"Legal": 40Treemaps display hierarchical data as nested rectangles, where each rectangle's area is proportional to its value. They make it easy to see which parts of a whole are biggest at every level.
Typical uses include budgets by department, disk usage by folder, bundle sizes by package and portfolio allocations.
When to use a treemap
- Budget allocation by department
- JavaScript bundle size analysis
- Disk usage by folder
- Portfolio allocation
Treemap syntax reference
| Syntax | What it does |
|---|---|
treemap-beta | Start a treemap. |
"Section" | A parent node (indent children beneath it). |
"Leaf": 42 | A leaf node with a value. |
classDef / :::class | Style nodes with classes. |
Treemap examples
Tips and best practices
- Indentation defines the hierarchy, like a mindmap.
- Only leaves need values; parents sum their children.
- Avoid very deep hierarchies — two or three levels read best.
Generate a treemap with AI
Not sure where to start? Describe what you need and the AI treemap generator writes the Mermaid code for you. Try prompts like:
- “Website bundle size by package”
- “Company headcount by department and team”
- “Time spent per project per month”
Treemap templates
Treemap FAQ
Do parent nodes in a Mermaid treemap need values?
No. Parent sizes are calculated from the sum of their children; only leaf nodes need a value.