AI pie chart generator
AI pie chart generator that turns labelled numbers into a Mermaid pie chart you can paste into Markdown.
By MermaidViewer editorsPublished Updated
Example prompts for a pie chart
- “Time spent per activity in a typical work week”
- “Market share of cloud providers”
- “Household monthly expenses”
What a Mermaid pie chart looks like
Example pie chart
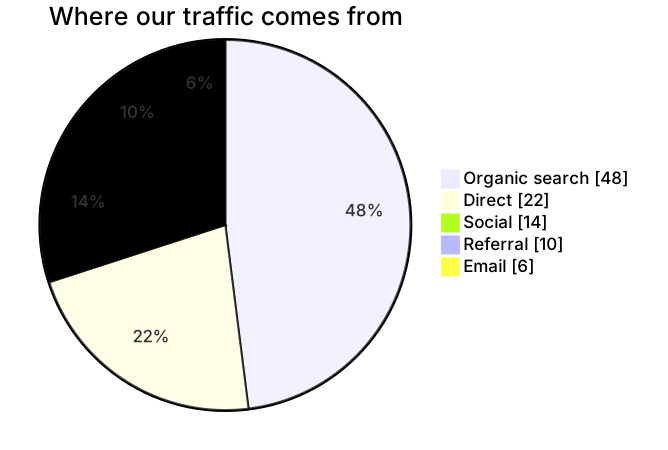
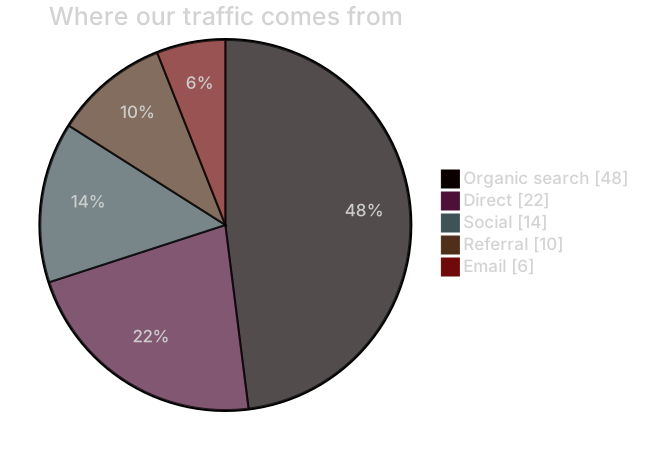
pie showData
    title Where our traffic comes from
    "Organic search" : 48
    "Direct" : 22
    "Social" : 14
    "Referral" : 10
"Email" : 6Want to write it by hand? See the full Mermaid pie chart syntax and examples, or browse templates.
Six slices is already a crowd, and an ai pie chart generator stays honest only when you give it raw counts and a short list of labels. Commute modes, bug severities, the genres on a classroom shelf: the chart is a share of a whole, and Mermaid will compute the percentages if you let it. The widget above writes the pie block. This page is about counts that add up in real life, and about the drafts that invent a tidy 100.
Charts that come out usable
Labels you typed usually survive, in the order you typed them. Integer counts survive better than percentages, because the model has less room to "round." showData appears when you ask for the counts in the legend, which is what you want in a report where a reader might not trust a wedge. A title sticks when you provide one sentence, not a paragraph.
The chart is also a good way to stop a slide from becoming a table of six numbers. Once the source is right, you can export and drop the image in a doc. The pie chart syntax is short on purpose: a title, then "Label" : number lines. There is no axis to mis-scale. The failure modes are about the numbers and the slice count, not about layout keywords.
Grouping the tail into Other is something the model will do if you say "keep six slices and put the rest in Other." It will not do that on its own. It would rather draw nine thin wedges with labels that collide.
The ways pies get fabricated
The model converts your counts into percentages and then writes those percentages as the values. You said 42 train riders and 18 cyclists. The source says "Train" : 42 and "Bike" : 31 because it tried to be helpful and then did the division wrong. Or it writes 70 and 30 when you asked for counts, and the title still says "riders." The legend and the title disagree, and the chart looks official.
Negative numbers and zeros sneak in from a year-over-year table you pasted. Pie slices cannot be negative. A zero slice is legal and useless. Too many categories is the other botch: every bug label in the tracker, including ones with a single hit. Labels with a colon or a quote break the line. A title that includes a colon sometimes gets parsed as a slice.
showData omitted is not a parse error. It is a trust error. Readers see 37% and cannot recover the 14 responses that produced it.
Numbers the prompt should state
Say less, and say the counts.
- The title, with no colon if you can help it.
- Each slice label in quotes-ready plain words.
- The raw count, and the unit in the title ("trips," "bugs," "books"), not in every label.
- Whether the legend should print those counts (
showData). - A cap on slices, and the name of the bucket for the rest.
- An explicit "do not convert to percentages."
The survey results pie template is a satisfaction survey with showData so the counts sit in the legend. Generate a new chart for commute modes or a genre shelf. Start from the template when you are publishing survey results and only the answer labels change. The prompt guide covers the editor. For pies, the rule is counts in, percentages out, computed by Mermaid rather than by the model.
Example prompts
- Pie chart titled How the class gets to school. showData. Values are trip counts, not percentages. Bus 36, Walk 22, Car 17, Bike 9, Other 6. Do not add a slice. Do not rescale the numbers.
- Pie chart titled Open bugs by severity. Counts from the tracker: Blocker 3, Critical 11, Major 28, Minor 40, Trivial 9. showData. Title must not say percent. Keep this order, most severe first.
- Pie chart titled Books on the classroom shelf by genre. Counts: Fiction 48, Science 21, History 16, Poetry 7, Graphic 14. showData. If you need a sixth slice, do not invent one. These five are the whole shelf.
Counts in, wedges out
The commute chart keeps the integers you would find in a tally sheet. Mermaid turns them into shares. The legend can show the tally because of showData.
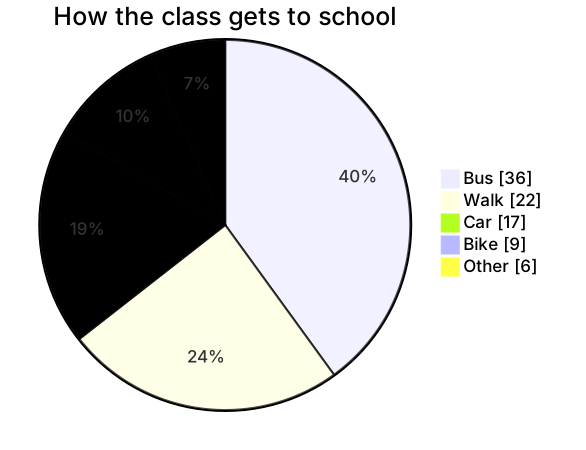
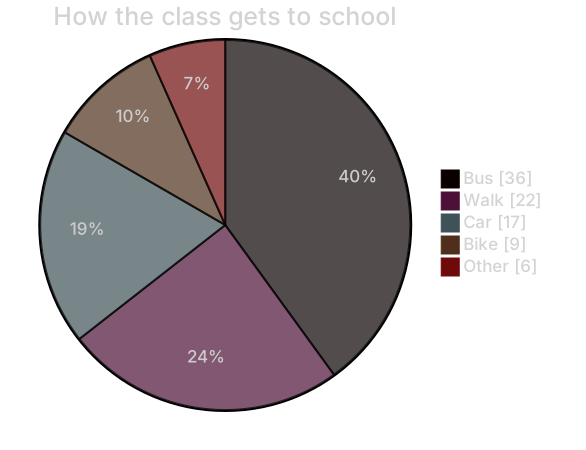
pie showData
    title How the class gets to school
    "Bus" : 36
    "Walk" : 22
    "Car" : 17
    "Bike" : 9
"Other" : 6Put it in the editor and change Bike from 9 to 11 if two more kids started riding. You do not recalculate percentages. That is the entire reason to keep raw counts in the source.
A bad pie, fixed two ways
Use an AI edit when the model converted your survey into percentages or added slices you did not name. "Restore these exact counts: Bus 36, Walk 22, Car 17, Bike 9, Other 6. Remove any slice not in that list. Add showData. Do not write percentages as values." That is worth a generation if five numbers are wrong and you do not want to retype labels you cannot see in a scrambled draft.
Edit by hand when one number is stale. Change 9 to 11. Delete a slice line. Add showData after pie. Rename a label. Hand editing stays free. A pie is a dozen lines. Regenerating it to fix a typo is how the free tries disappear.
If the chart fails to render, look for a colon inside a label, a missing quote, or a percent sign on the number. "Bike" : 9 is the whole grammar. Strip the line back to that pattern in the editor and the preview returns. Then put the title back.
Free uses, and the plans after them
The complimentary set is five AI uses in total. They do not reset overnight. The account, the IP address, and a device cookie are all counted, so a second browser on the same network does not create a new pile of five. A pie often succeeds on the first try. It needs a second try when the model "helpfully" normalizes to 100. Take that second try if the values are wrong. Afterward, tweak counts by hand.
See pricing for the paid allowances. At $6.99 a month, Starter covers 500 AI conversations in that month. Pro is $11.99 a month and includes unlimited AI under fair use, for a person making diagrams through the week. Hand editing remains free, including once the five uses are spent. Export remains available. A pie in a monthly report can be updated by changing one integer.
When the comparison is categories over time, or several series, a pie is the wrong instrument. The AI diagram generator hub includes a bar chart generator for that. Use this page when the story is a share of one whole, and you have the counts.
Frequently asked questions
How do I generate a pie chart with AI?
Describe the pie chart you need in the box above and click Generate. The AI writes valid Mermaid pie chart code that renders instantly, and you can open it in the editor to refine it.
Is the AI pie chart generator free?
You can try it free: 5 AI generations in total, not per day, with no sign-up. Starter includes 500 AI conversations a month and Pro is unlimited. Manual editing stays available, and every plan can still download a PNG. JPG, SVG and PDF are on Pro.
Can I edit the generated pie chart?
Absolutely. The output is plain Mermaid code — edit it by hand in the live editor, or ask the AI for changes in natural language.